
Can an action queue replace the source system?
It can perform actions when the integration safely supports them. Otherwise it should deep-link to the authoritative record and confirm when that source changes.
Web Apps & Software
Connect metrics to underlying records, thresholds, owners, and next actions so an internal dashboard supports daily operational work.

How the workflow connects
A dashboard can display accurate numbers and still leave the team working from spreadsheets and inboxes. The missing layer is often an action queue: the records behind a metric, ordered by urgency, with ownership and permitted next steps.
Choose a recurring decision such as which overdue requests need escalation, which orders are blocked, or which approvals will miss a deadline. Define the population, calculation, acceptable delay, and action that follows. Only then select the summary and visualization.
When a person selects a number, show the exact records included under the same filters and data timestamp. Explain exclusions and unknown values. If a metric comes from a daily snapshot, do not present the drill-down as live data without stating the difference.
An action queue can combine due date, business impact, customer commitment, and exception type. Display why an item is prioritized and let authorized staff adjust ownership or escalation. A hidden score is difficult to trust and harder to improve.
Track queue age, time to ownership, resolution time, reopened items, and unresolved exceptions. These measures show whether the dashboard improves the operating loop. Page views and chart interactions alone do not establish that the work became clearer.
Suppose a dashboard shows 27 overdue service requests. The number creates urgency but not action. A useful drill-down lists the request, customer, owner, current state, age, overdue reason, last activity, and permitted next step. Staff can distinguish an unassigned request from one waiting on the customer or blocked by an external system.
Define the metric and queue from the same record logic. If overdue means the next-action due time has passed while the request remains open, both the card and the queue should use that rule. Document timezone, paused states, cancelled records, and data freshness so managers do not compare numbers built from different assumptions.
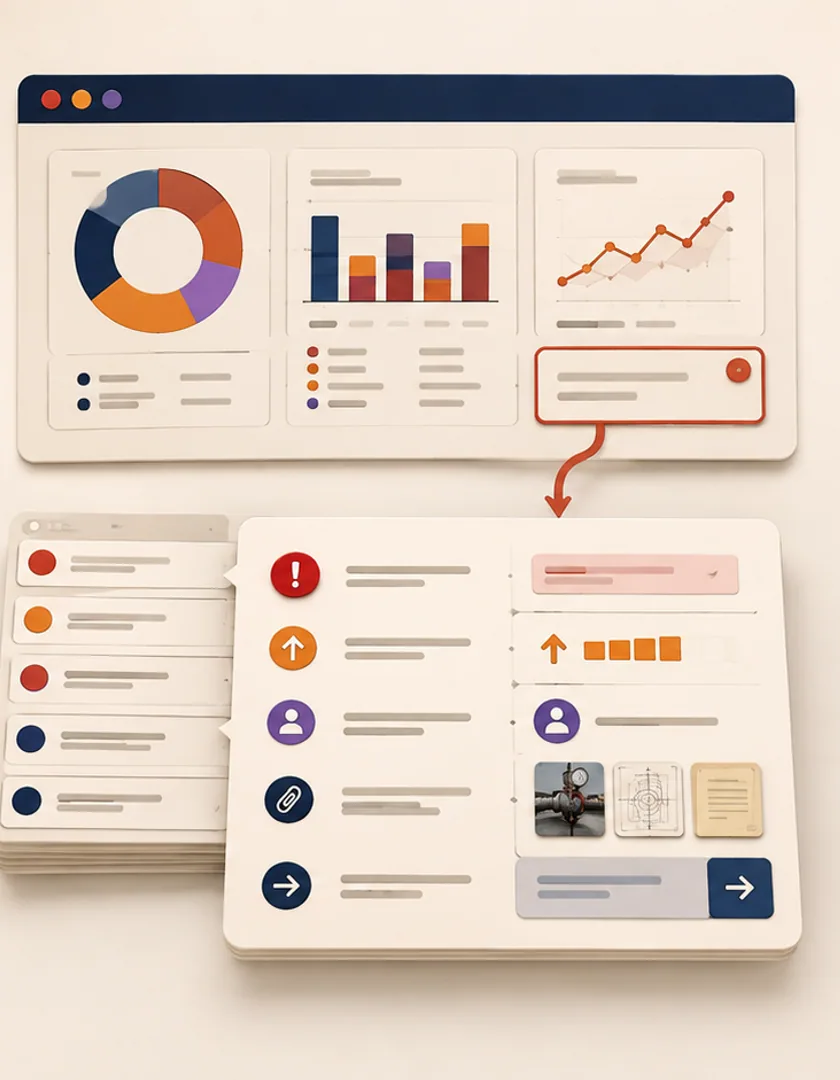
Visual guide
A dashboard supports operations when every summary can lead to the records, context, and action behind it.
Metric
A defined count or measure with scope and freshness.
Drill-down
The exact records included by the same definition.
Priority rule
Visible ordering by consequence, age, commitment, or policy.
Owner
The person or queue responsible for the next decision.
Action
A permitted update whose result returns to the workflow.
Track whether users open the drill-down, assign work, resolve exceptions, and reduce the age of pending items. If teams export the queue to a spreadsheet every morning, the dashboard may lack a necessary bulk action, field, or planning view. If alerts are acknowledged but not resolved, ownership or authority may be unclear.
Roll out with one operating meeting or queue rather than every possible report. Agree who owns metric definitions, data-quality corrections, access, and change requests. Review false urgency, stale records, missing drill-down context, and decisions still made outside the system before adding more visualization.
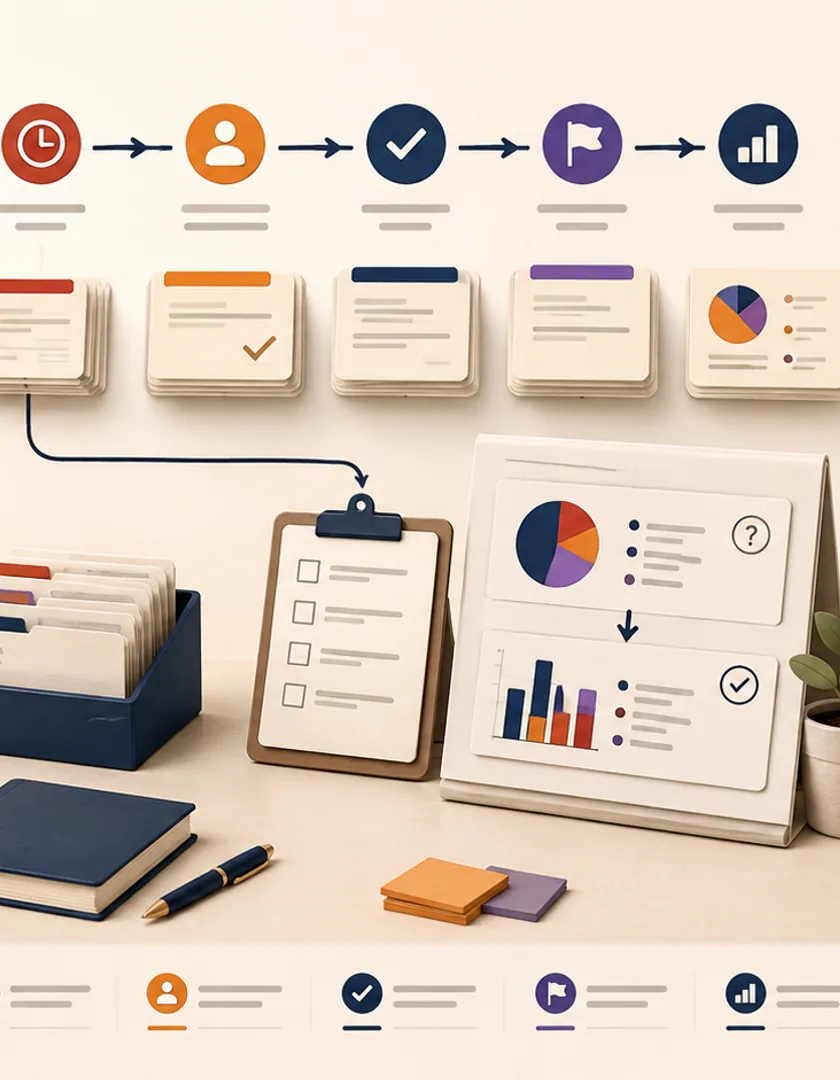
| Signal | What it may reveal |
|---|---|
| Oldest unresolved item | Whether critical work continues to wait |
| Time to ownership | Whether routing and responsibility are clear |
| Reopened items | Whether completion criteria are reliable |
| Spreadsheet exports | Missing workflow or planning capability |
| Data corrections | Source quality or definition problems |
Practical questions
It can perform actions when the integration safely supports them. Otherwise it should deep-link to the authoritative record and confirm when that source changes.
Use the smallest set needed to frame the decisions and queues in scope. Additional reporting can follow once the operating workflow is adopted.
Continue exploring
Work with Sun Cluster
Sun Cluster develops internal dashboards that connect operational metrics with records, ownership, and action.